QELI Percent Developed by Year
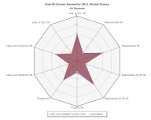
These radar charts show the percent developed on all six QELI subtests within a particular year.
QELI Percent Developed by Subtest
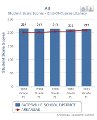
These bar charts show the percent developed in each of the six QELI subtests over time.
NOTE: Because Arkansas Better Chance (ABC) has an income eligibility requirement, these charts only include the subset of students on Free/Reduced Lunch in the comparison groups 'No Known PreK' and 'Arkansas'.
NOTE: In cases where the number of students is less than 10, the results are not reported in order to protect student privacy.
Arkansas Research Center • 501-852-2296 •
Subscribe to the ARC mailing list